
The residual formula in statistics is used to calculate the difference between observed and predicted values. It is given by the equation: residual = observed value – predicted value.
Understanding the residual formula is key for anyone involved in statistical analysis or predictive modeling. Residuals are crucial for diagnosing the fit of a statistical model to the observed data. Essentially, they represent the error in predictions made by the model.
When plotting residuals, patterns can emerge that indicate whether the model is appropriate, or if modifications are necessary. For anyone working in fields reliant on accurate forecasting or trend analysis, such as finance, marketing, or research, mastering the concept of residuals can be a significant asset. Not only does it enhance the interpretation of model results, but it also informs better decision-making, ensuring that future predictions are as accurate as possible.
The Essence Of Residuals In Statistical Models
The Essence of Residuals in Statistical Models lies in understanding what they represent and why they’re crucial. In statistics, residuals are the differences between observed values and predicted values in a model. They tell us how well our model fits the real data. Think of them as the gap between expectation and reality. Grasping the essence of residuals can unlock the truth behind the data.
Key Components Of Residual Analysis
Residual analysis involves several key elements that help in assessing a statistical model.
- Error Term: The unexplained part of the observed value.
- Predicted Value: The estimated result from the model.
- Actual Value: The real outcome we observe in the data.
- Residual Value: The difference between actual and predicted values.
These components work together to diagnose potential issues. They can reveal patterns or suggest improvements for the model.
Role In Model Accuracy
The role of residuals in model accuracy is pivotal. Understanding residuals helps in fine-tuning models for better predictions. Here’s how residuals matter:
| Residual Aspect | Impact on Model Accuracy |
|---|---|
| Size of Residuals | Smaller residuals mean better model fit. |
| Pattern of Residuals | No pattern suggests a good fit; a pattern indicates bias. |
Residual plots showcase these aspects visually. Residuals guide in enhancing predictive power, and they directly affect a model’s reliability.
Dissecting The Residual Formula
In statistics, we often seek to understand relationships between variables. Residuals are differences between observed and predicted values. They show how close the predictions are to the actual results. Grasping the residual formula is like learning to find what slipped through the net during a fishing trip. Our catch here? The insights into data’s behavior.
The Mathematics Behind Residuals
The formula e = y – ŷ represents a residual. Here, e denotes the residual, y is the observed value, and ŷ signifies the predicted value. The predicted values come from our statistical model’s best-fit line. Check out the key steps:
- Plot data points on a graph.
- Draw the best-fit line through these points.
- Calculate the predicted value (ŷ) for each data point.
- Subtract the predicted value from the observed value (y) to find the residual (e).
Let’s see how a single residual calculation works:
| Observed Value (y) | 50 |
| Predicted Value (ŷ) | 45 |
| Residual (y – ŷ) | 5 |
In this case, the model underestimates the observed value by 5 units.
Interpreting Residual Outputs
After computing residuals, their patterns lead us to conclusions:
- Zero Residuals: Perfect predictions. Rare in real-life data.
- Random Distribution: Good model fit. Predictions are reliable.
- Non-Random Patterns: Model may have missed important factors.
Visualize residuals using a residual plot. This graph helps detect patterns, outliers, or trends that the model didn’t capture. Plot the residuals on the y-axis against predicted values on the x-axis.
For a good model, you’d see the points scattered randomly around the horizontal axis (zero). A curve or a slope suggests reevaluating your model.
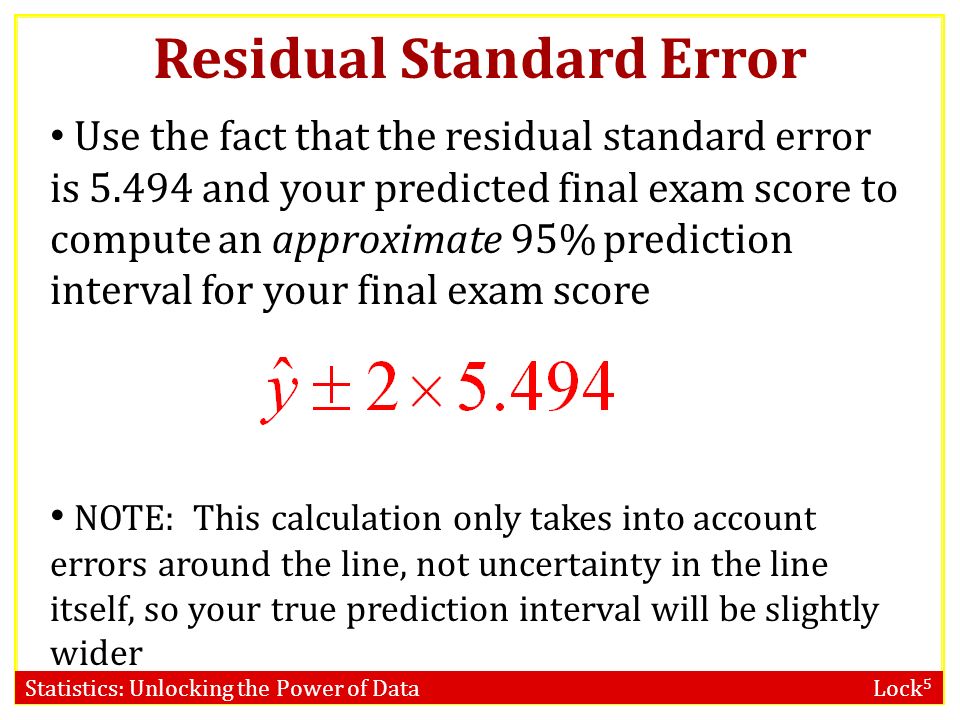
Predictive Strength Of Residuals
The ‘Predictive Strength of Residuals’ is a key concept in the realm of statistics. Residuals help us understand how well a predictive model fits the actual data. In simple terms, they are the difference between observed values and the values predicted by a model. Getting familiar with residuals means you can tell if a model is good or needs work. This section will explore how residuals act as performance indicators and how they can enhance predictions.
Residuals As Indicators Of Model Performance
Residuals shed light on the accuracy of statistical models. A small residual means a prediction was close to the real value. Good models have smaller and random residuals. If residuals show a pattern, the model might be missing something important. This insight allows for better model adjustments and, subsequently, more precise predictions.
Improving Predictions Using Residuals
To improve a predictive model, examining residuals is crucial. Residual analysis can help pinpoint where a model falls short. Tweaking a model based on residual data can reduce prediction errors. For instance:
- Spot trends: Look for patterns in the residuals.
- Identify outliers: Find and consider data points that stand out.
- Adjust model: Make changes to better capture the true data relationships.
The goal is to achieve residuals scattered randomly around zero. When this happens, it suggests that the variability in the data has been successfully captured by the model. Enhancing predictions with the help of residuals means more reliable results in any statistical analysis.
Credit: slideplayer.com
Residuals Vs. Errors: Clarifying Concepts
Delving into the world of statistics brings up vital concepts that require careful distinction. Understanding the difference between “residuals” and “errors” is crucial when interpreting regression analysis results.
Both play significant roles, yet they are distinct entities. Residuals reveal the distance between observed and predicted values, whereas errors speak to the divergence we never see — the gap between true values and predicted ones.
Understanding Error Term Significance
The error term represents unobserved variation in a model. When we create a statistical model, we attempt to predict outcomes based on certain inputs. The error term encompasses all the factors that the model doesn’t account for.
- Latent Variables: Influences not included in the model.
- Measurement Error: Discrepancies arising from data collection.
- Theoretical Limitations: Constraints of the model’s predictive capabilities.
Recognizing the error term’s importance helps refine model development and enhances the accuracy of predictions.
Residuals: Post-estimation Reality Checks
Residuals emerge from the actual computation of a model. They are the differences between observed values and the values the model predicts.
These values enable us to perform diagnostic checks:
- Assessing model accuracy.
- Identifying potential outliers.
- Checking for model assumptions, like homoscedasticity.
Scrutinizing residuals ensures that the model is correctly specified and reliable for forecasting.
Graphical Representation Of Residuals
Understanding residuals is key in statistical analysis. Graphical representation of residuals makes it easy to see data patterns. This can help find problems with a statistical model.
Residual Plots Revealed
Residual plots are graphs that show residuals. On the x-axis, we put the predicted values. On the y-axis, we have the residuals. They reveal if a model works well with the data. A good model has scatter with no clear pattern.
Insights From Visualizing Data
Visualizing data with residual plots offers great insights. These plots can show certain data trends:
- Linear patterns: They suggest a linear relationship.
- Curved patterns: They may point to a non-linear relationship.
- Clusters: These could indicate groups or outliers in data.
Critical Assumptions In Residual Analysis
Exploring the underpinnings of residual analysis reveals three assumptions essential for its accuracy. These are normality, linearity, and homoscedasticity. Ensuring the validity of these assumptions is crucial in the reliability of test results from regression analysis.
Normality
The assumption of normality states that residuals should follow a normal distribution. This means that most data points should cluster around the mean, with fewer and fewer observations the further out from the mean you go, producing the familiar bell-shaped curve.
- Kolmogorov-Smirnov test
- Shapiro-Wilk test
- Normal Q-Q Plot
Linearity
Linearity suggests that the relationship between independent and dependent variables should be linear. This is visually assessed using scatter plots where residuals are plotted against predicted values.
Here’s how to check for linearity:
- Scatter Plot Analysis: Look for a random pattern.
Homoscedasticity
Homoscedasticity means variances along the line of best fit remain similar as you move along the line. In contrast, heteroscedasticity shows a spread that increases or decreases with the fitted values.
To visualize homoscedasticity:
- Plot residuals against fitted values.
- Look for consistent spread.
Testing The Assumptions
Test these critical assumptions before drawing conclusions from your statistical model.
| Assumption | Diagnostic Tool |
|---|---|
| Normality | Q-Q Plots, Statistical Tests |
| Linearity | Scatter Plot Analysis |
| Homoscedasticity | Residual vs. Fitted Value Plot |
Consider these methods for testing:
- Plotting residuals to assess patterns.
- Statistical tests to quantify normality.
- Regression diagnostics for identifying variance issues.
Impact Of Outliers On Residuals And Predictions
Understanding residuals in statistics is key to fine-tuning predictive models. Residuals are the difference between observed and predicted values. Outliers can skew these residuals, affecting the overall model’s accuracy. Diving into the impact of outliers on residuals and predictions unpacks how these data points can distort statistical analyses.
Identifying Influential Points
Outliers or influential points have a significant pull on a regression line. To maintain a reliable model, identifying these points is crucial. Outliers can make predictions less precise. By plotting residuals against predicted values, outliers become visible.
- Residual Plots: Graphs that show the pattern of residuals.
- Leverage Stats: Measure how far an independent variable strays from its mean.
- Cook’s Distance: Indicates the extent of impact on a regression model.
Mitigating The Impact On Predictive Models
Predictive models must be robust to outliers. Analysts aim to lessen these effects. There are several strategies for doing so:
- Data Cleaning: Remove or correct outliers when they are errors.
- Transformations: Apply log or square root transformations to reduce skewness.
- Robust Regression Techniques: Use algorithms less sensitive to outliers.
Each method improves the model’s resilience to outliers. This enhances the accuracy of future predictions. Always handle outliers with care to preserve the integrity of the data.
Credit: www.wileyplus.com
Case Studies: Real-world Applications Of Residuals
Behind every data point lies a story waiting to unfold. In the world of statistics, residuals help us understand those untold narratives. A residual can signal a mismatch between observed values and those predicted by a model. By studying these deviations, we can sharpen our predictions and strategies in various fields.
Below lie compelling case studies showcasing how residuals become powerful tools in diverse real-world scenarios.
Improving Economic Forecast Models
An accurate economic forecast is crucial for policy makers and businesses. Residuals play a vital role in refining these predictions. By examining the residuals of existing models, economists can:
- Identify patterns that the original model might have missed
- Adjust the model to accommodate new insights
- Improve the accuracy of future economic forecasts
For instance, the residual analysis of GDP growth predictions can reveal overlooked factors. Scientists use this information to tweak the model, rendering more precise forecasts.
Enhancing Sports Performance Predictions
In the realm of sports, the stakes are high and the margins for error are slim. Residuals guide teams in refining their strategies. They look at past games to predict future performance. Residual analysis helps in:
- Understanding a player’s performance against expected outcomes
- Detecting areas needing improvement
- Formulating training methods to address these gaps
Take a basketball player whose scoring is below predictions. Coaches analyze the residuals to alter training and boost performance. They then observe how these changes affect future residuals.
Future Of Residual Analysis In Predictive Modeling
Residual analysis plays a pivotal role in predictive modeling. It is the craft of diagnosing and interpreting the differences between predicted and actual outcomes. As we envision the future, the scope of residual analysis broadens, embracing even more sophisticated methodologies for better, sharper predictions. This journey into the future is laden with innovation and enhanced accuracy, making residual analysis a cornerstone of predictive analytics. Let’s dive into emerging techniques and challenges that await.
Emerging Techniques And Technologies
The universe of predictive modeling is always expanding. As it does, new techniques and technologies surface. These advancements aim to refine how we understand and adjust residuals for enhanced model performance. Among these are machine learning algorithms that automatically detect patterns in residuals, hinting at model shortcomings. Another wave features visualization tools offering deeper insights into data anomalies and predictive nuances. A table illustrating some key emerging techniques might look like this:
| Technique | Function |
|---|---|
| Automated Residual Analysis | Uses AI to spot and categorize residual trends |
| Real-time Residual Tracking | Monitors and reports residual patterns as data flows |
| Interactive Residual Plots | Creates dynamic visuals for in-depth residual examination |
Challenges And Opportunities Ahead
With innovation, inevitably come challenges and opportunities. The potential to dramatically enhance predictive accuracy exists, but so do the obstacles. One such challenge is the sheer complexity of new statistical methods which require a high level of expertise. An opportunity lies in education, with the rise of online courses and materials that demystify complex concepts. Advances in computing power allow for more detailed residual analysis over larger datasets, revealing patterns previously obscured by computing limitations.
- Complexity Management: Tools to simplify sophisticated analysis methods
- Education and Training: Accessible learning resources for developing expertise
- Computational Advancements: More powerful systems to handle extensive data analysis
The future of residual analysis stands at an exciting juncture. It holds promise for better decision-making across various fields, grounded in data-backed predictions. Preparing for this future means embracing both the complexities and the learning curve, to harness the full potential of residual analysis in predictive modeling.

Credit: www.chegg.com
Frequently Asked Questions For Residual Formula Statistics
How Do I Find The Residual In Statistics?
To find a residual in statistics, subtract the observed value from the predicted value within a dataset. This difference represents the residual for each observation.
What Is The Formula For Residual Value?
The residual value formula is not a one-size-fits-all equation but rather a company’s estimated value of an asset at the end of its lease or useful life. It often factors in depreciation rates and market value assessments.
How Do You Calculate Standard Residuals?
To calculate standard residuals, subtract the predicted value from the observed value and divide by the standard deviation of the residuals.
What Is The Residual Method Math?
The residual method in math calculates the residual value by subtracting observed values from predicted values in a regression model.
What Is Residual In Statistics?
A residual in statistics refers to the difference between a data point and the predicted value from a regression line, highlighting the error in prediction.
How Do You Calculate Residual?
To calculate a residual, subtract the predicted value from the observed (actual) value of the dependent variable.
Conclusion
Understanding the residual formula is crucial for anyone delving into statistical analysis. By mastering this concept, you can unlock deeper insights from data sets and make more informed decisions. Embrace this key tool to enhance your analytical prowess and drive towards success in your statistical endeavors.
Keep exploring, keep learning, and let the power of statistics guide your path.